Many product detail pages list numerical dimensions but fail to visually tie those numbers to the product itself. Embedding labeled, marked “dimensions” images bridges this gap, reducing returns, boosting conversions, and improving user trust. This article outlines why and how to implement dimension visuals, offering a practical roadmap with strong ROI.
Why Visual Dimensions Matter: Business and UX Benefits
When product dimensions are communicated only through text, shoppers are left to imagine the scale – often inaccurately. Labeled visuals remove this guesswork. Surveys reveal that 75% of online buyers consider product images to be “very influential” in their decisions, and 22% have returned products because the actual size differed from what they expected.
Accurate visuals don’t just inform; they build confidence. When users immediately understand a product’s size in context, they are more likely to proceed to checkout. Rich visual content has been shown to increase engagement by up to 30% and boost conversions by 20–40%.
Common UX Failures: Specs Without Visuals
Relying solely on numerical listings creates unnecessary cognitive friction. Users must read dimensions, mentally map them onto images, and determine whether the product fits their space or use case. This extra effort leads to hesitation or abandonment.
Many product pages miss this opportunity, especially in categories like furniture, home decor, and large toys, where spatial fit is critical. Without labeled visuals, users may underestimate size, undervalue the product, or mistrust the listing altogether.
The Psychology of Scale Perception
The human brain processes images far faster than text – as quickly as 13 milliseconds. A single labeled image showing width, height, and depth communicates what a paragraph of specs cannot. This instant clarity reduces decision fatigue and enhances perceived professionalism.
Including familiar objects for scale or side-by-side comparisons further aids interpretation. Dimension visuals are not just informative; they are persuasive.
Measurable Impact: Returns, Conversions, and Trust
Reduced returns: Pages with clear size indicators see up to 50% fewer returns.
Increased conversions: Products presented with clear, contextual visuals experience a 20 – 40% lift in purchase rates.
Higher engagement: Time on page increases, bounce rates drop, and customers are more likely to recommend the store.
These results are not limited to any one category. From toys to appliances, the benefit of visual clarity is universal.
Best Practices for Implementation
Placement and Format
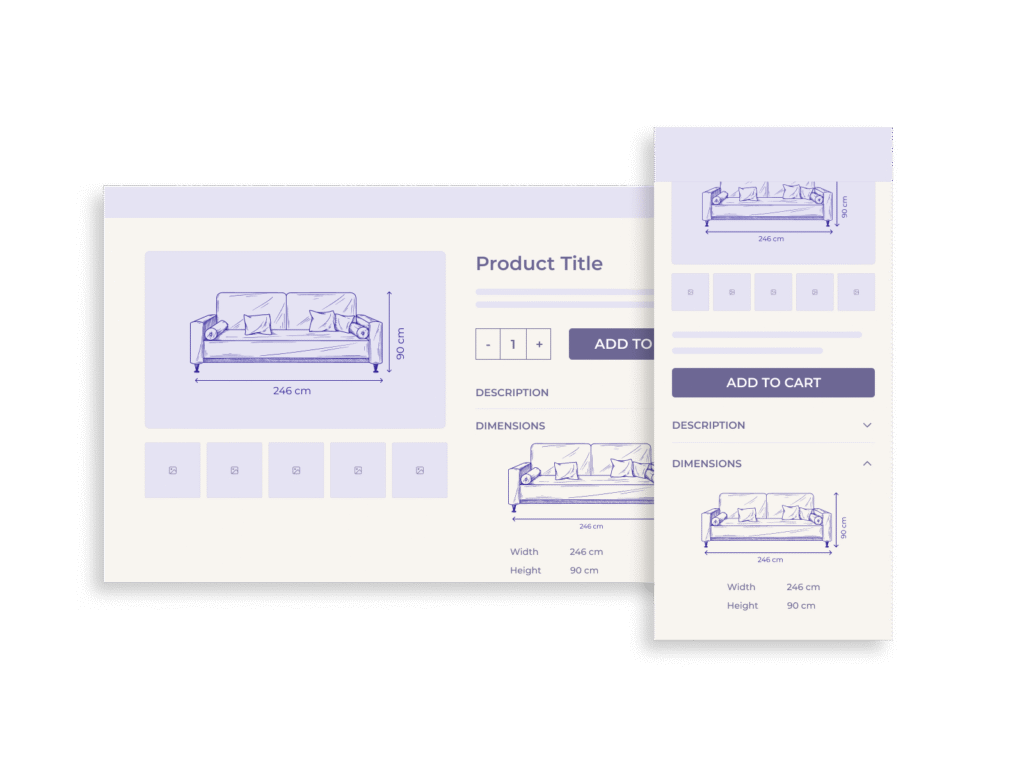
- Embed the dimensions image near the primary gallery or in the carousel.
- Use labeled arrows or overlays to identify height, width, and depth.
- Avoid clutter—the image should remain clean and legible.
Design and Accessibility
- Use high-resolution images with zoom functionality.
- Maintain consistent styling and labeling across SKUs.
- Include descriptive alt text for all dimension visuals.
Automation Strategies
- Automate the creation of overlay images using product spec data and templates.
- Integrate this into the product onboarding workflow to reduce manual design effort.
SEO and Behavioral Impact
Labeled images contribute to long-tail search visibility. Queries like “120 cm desk dimensions” or “does this sofa fit in a 90-inch space” benefit from image-indexed results.
Additionally, users spend more time on pages that include detailed visuals, signaling higher relevance to search engines and improving organic rankings.
Cost-Benefit Analysis and Roadmap
Estimated ROI Per SKU
| Metric | Without Dimension Images | With Dimension Images |
| Return Rate | ~17% | ~8 – 10% |
| Conversion Rate | Baseline | +20 – 40% |
| Production Cost | Low–Moderate | ROI within 3–6 months |
Five-Phase Implementation Roadmap
Phase 1: Audit (Weeks 1–2)
- Identify high-impact SKUs (e.g., oversized or high-return products).
- Gather missing or inconsistent spec data.
Phase 2: Design Template (Weeks 2–4)
- Create standardized dimension overlay styles.
- Ensure mobile compatibility and accessibility.
Phase 3: Pilot (Weeks 5–8)
- Apply to 20–50 flagship SKUs.
- Run A/B tests to measure impact on conversions and returns.
Phase 4: Scale (Months 3–6)
- Automate overlays for entire catalog.
- Integrate into product onboarding workflow.
Phase 5: Optimize (Ongoing)
- Refine overlay design and placement.
- Monitor engagement, bounce rates, and feedback.
Conclusion
Adding dimension images to product pages isn’t just a design enhancement—it’s a conversion strategy. By eliminating ambiguity, reinforcing trust, and visually communicating scale, retailers reduce returns and increase buyer confidence. The implementation cost is modest; the payoff is transformative.